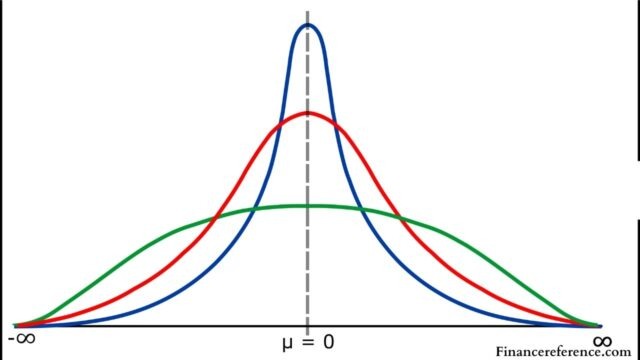
Probability and statistics concepts are essential in different fields, including business, engineering, and science. One of the primary statistical distributions that you should understand is the normal distribution. However, when working with small samples, the t-distribution often comes in handy. Both the normal and t-distribution follow the 68-95-99.7 rule. However, there are distinct differences between these two distributions. In this blog, we’ll delve into the differences between these two distributions.
What is normal distribution?
Normal distribution is a bell curve-shaped function that is symmetrically distributed around the mean. The primary characteristic of normal distribution is that the entire data falls within 3 standard deviations from the mean. The percentage for data that falls within these deviations and is known as the 68-95-99.7 rule. Approximately 68% of the data lies within one standard deviation from the mean, 95% within two standard deviations, and 99.7% within three standard deviations.
What is t-distribution?
The t-distribution is also a bell-shaped function, similar to the normal distribution. However, the major difference between these two is the t-distribution’s flatter shape. A t-distribution has thicker tails than a normal distribution. The t-distribution is ideally used when the sample is small, and the population variance is unknown; thus, the individual population’s characteristics are represented by the sample itself. In most cases, t-distribution is used when the sample size is less than 30.
How is the 68-95-99.7 rule applied?
The 68-95-99.7 rule is a crucial concept in statistical data analysis. It gives us a rough picture of the dispersed data of a different data distribution. In the normal distribution, the general rule is that around 68% of observations should fall within one standard deviation from the mean value of the population, while the other 32% of observations fall outside. Additionally, 95% of observations fall within 2 standard deviations of the mean, and 99.7% of observations fall within 3 standard deviations.
In t-distribution, the 68-95-99.7 per cent areas under the t-distribution curve are estimated the same way as for the normal distribution. The only difference is the degree of freedom, which influences the calculation of the probabilities. The degree of freedom calculation depends on the sample size of the population sample.
What are the differences between the 68-95-99.7 in the t-distribution and normal distribution?
As described earlier, the 68-95-99.7 rule applies to both distributions. The difference, however, lies in the size at which they can be used. In the normal distribution, this rule can be applied to sample sizes of any number. However, in the t-distribution, the application of this rule is limited to sample sizes of less than 30.
In conclusion, both t-distribution and normal distribution follow the 68-95-99.7 rule. The difference is that the t-distribution is used when the sample size is small, or the population variance is unknown while the normal distribution is used when the sample size is large enough, and the population variance is known. Understanding this difference is essential since it helps statistical scientists to come up with accurate data and eliminate errors in the calculation of probability and statistical data analysis. As such, it is crucial to identify when to apply each distribution in the right statistical problem.


